Profiling ASP.NET 5 Applications with ANTS Performance Profiler
Related Posts
One of the biggest challenges with ASP.NET 5 is the fact that most of the existing tools and libraries are not supporting the ecosystem as it’s a complete revamp of the runtime and some of the concept we have been used to in both development and production. However, some tools catch up quite surprisingly fast and one of those tools is ANTS Performance Profiler from Redgate and it allows you to profile your ASP.NET 5 applications to spot performance problems in a really easy and unobtrusive way.
ANTS Performance Profiler is a paid tool but it has a 14-day free trial option. Also, if you are a Microsoft MVP, you can get a free license for this tool. If this sounds like you, visit Redgate community page and claim your free license by following the instructions there.
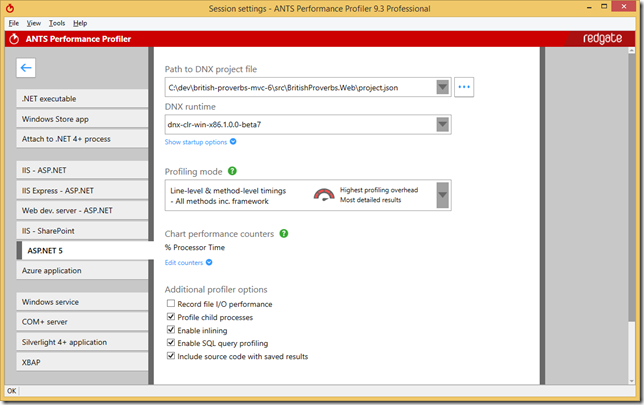
When you open up ANTS .NET Performance Profiler, you should immediately notice the ASP.NET 5 section:
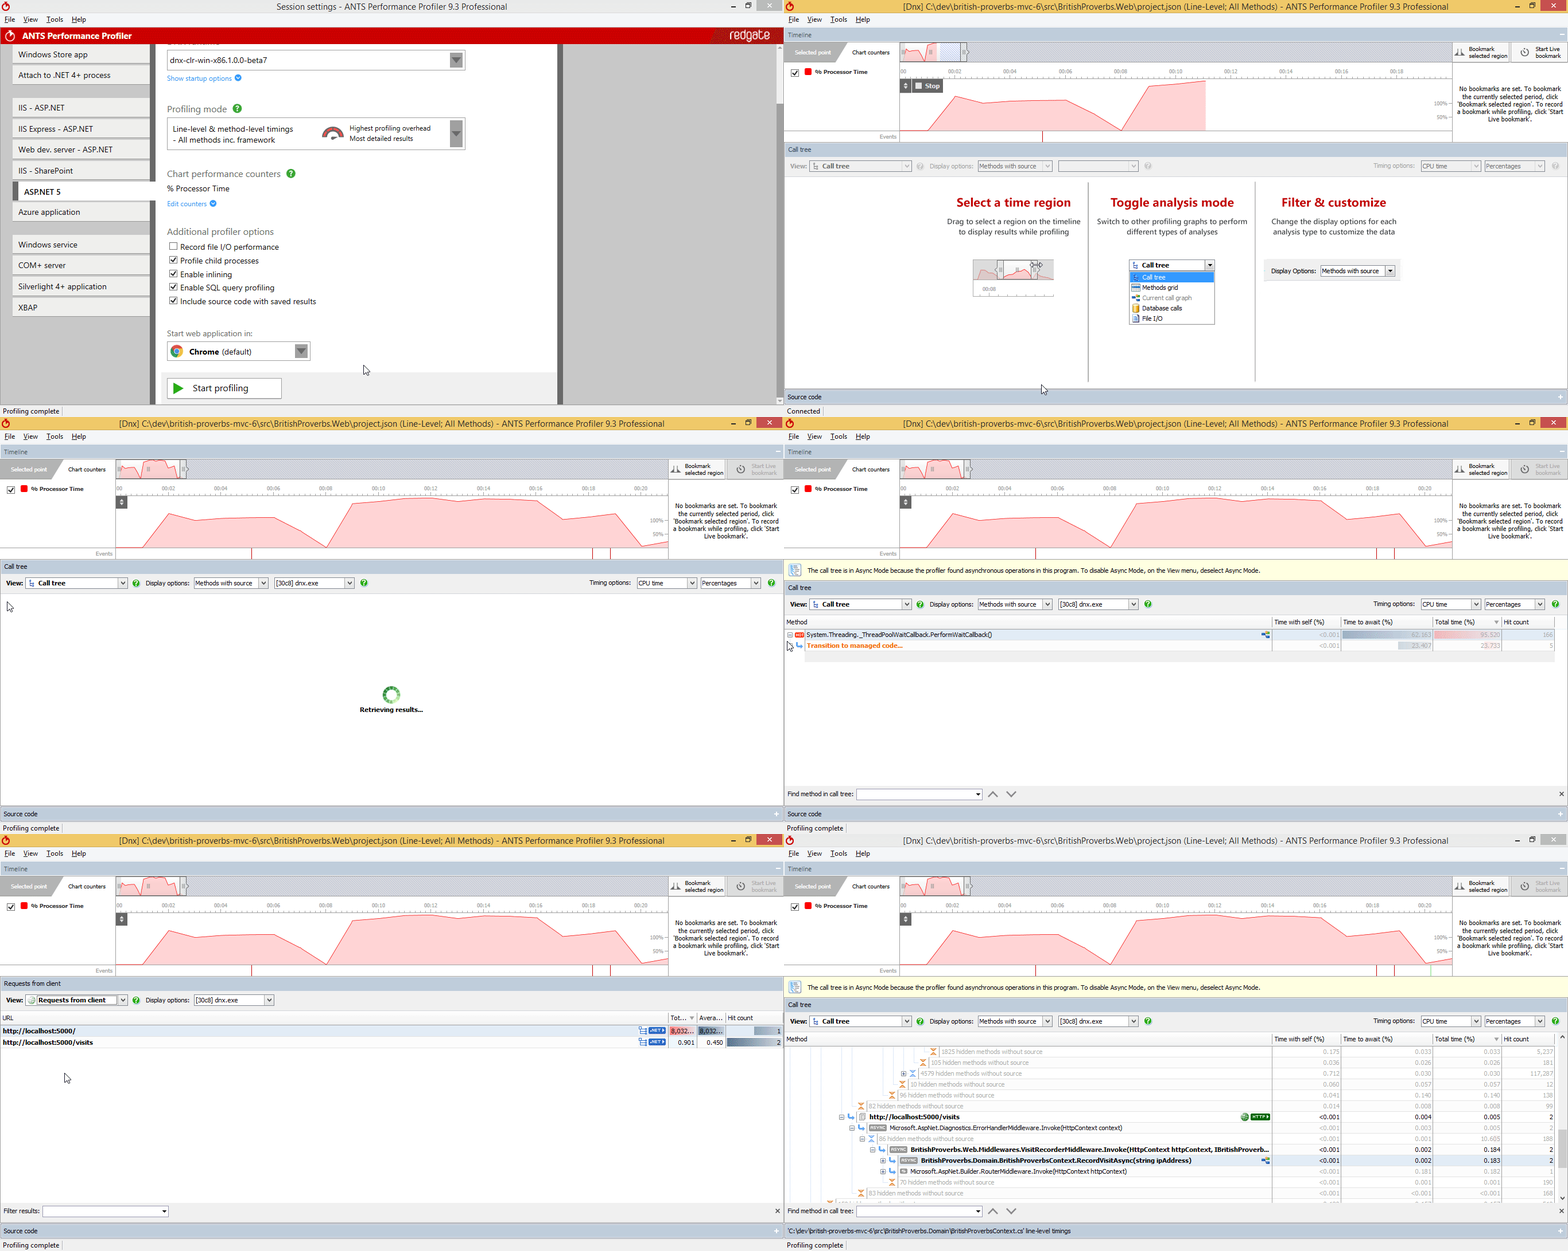
From there, it’s all pretty straight forward to move along. Just select the project.json file path for your application and the DNX runtime that your application should run on. Optionally, you can configure other profiling options like collecting additional performance counters. When you are ready, you can just hit the "Start profiling" button and go!
One feature that I am in love with here is incoming HTTP requests view. The tool knows about received requests during the profiling session and you can see where they started on the class stack:
You can see that you are able to see the hint count and average times for request to complete. From here, I can jump straight to the HTTP request that I am interested in:
Notice that it starts with ErrorHandlerMiddleware on the call tree. The reason is that it’s the first middleware in my middleware chain and I configured ANTS Performance Profiler to only show me the methods with source as you can see at top on the screenshot above. So, it filtered the call stack a little for me and I can look at the source of the actual methods if I want to:
Profiling Bottlenecks
ANTS Performance Profiler makes it extremely easy to spot bottlenecks in your applications. I will show you a sample based on a personal experience I had before but I will fake the problem here a little :) However, the narrative is quite similar to what I went through but I struggled a lot more that this as I didn’t use a profiling tool to understand the problem.
In my simple sample, I have an object which I know that it will take a bit time to construct because of its nature and I am fine with that. The good news is that this object is thread safe and I can share it among multiple requests. However, I am seeing big CPU spikes when I run my application. To spot the problem, I ran a profiling session with ANTS Performance Profiler. Right after stopping the profiling session, I landed on the problem. So easy and that makes me perfectly happy!
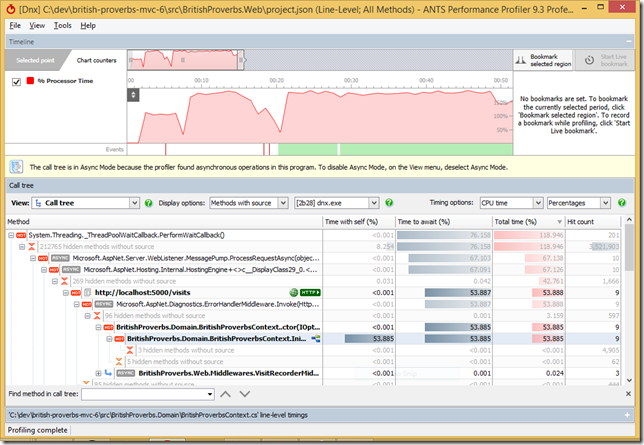
I know that the constructor could have been the problem but I really didn’t expect it to be this much. I know that it takes around ~2 seconds to be constructed under a good functioning CPU but when I look at the actual time spent there, it’s around ~32 seconds:
So, that’s not normal at all and as soon as I saw that number, I turned my eyes to hit count. There, I saw that it has been called 9 times! That’s way more than expected as I only wanted a single object for the whole application. I am only constructing this object through my IoC container and in this case, it should only mean that my IoC container has been configured wrong. When I look at the configuration of my services, I saw the actual problem:
This should have been registered as singleton but as you can see, it is scoped per request which causes it to be constructed for each request. It is not like I wouldn’t be able to spot this without the profiling tool but it makes it so much easy and fast. I actually wanted to try this as a sample because I had the first hand experience on this problem. Believe me! Spotting the exact problem was so much harder through debugging!
OK, if we go back to our issue again: changing the dependency registration to make it singleton solves the problem nicely:
Check out ANTS Performance Profiler documentation for more information about this tool. The other perfect resource on .NET performance profiling is Practical Performance Profiling book which you can download the PDF version for free.
Happy profiling .NET people :)
